Case Study — Audit & Compliance
Continuous Controls Monitoring, for an enterprise audit & compliance client
From a 300-transaction sample to testing every transaction, every run.
The brief
Our client tests business controls for large enterprises — checking whether purchase orders were raised at the right price, whether returns were processed against SKUs still eligible, whether the same invoice got paid twice. The traditional way to do this is to pull a sample of a few hundred transactions after the quarter closes and work through them by hand.
The problems are obvious once you say them out loud. A sample of 300 out of 60,000 transactions misses almost everything. By the time anyone finds a problem, the money has left the building. And every cycle starts from scratch, because the work lives in someone's spreadsheet.
They wanted to stop sampling. Test the entire population, continuously, and have the exceptions land in front of the person who can actually fix them. We took that from a whiteboard to a deployed product.
What we built
Five pieces, in the order data moves through them. The interesting engineering was almost never in this list — it was in the gaps between these five boxes.
Data ingestion
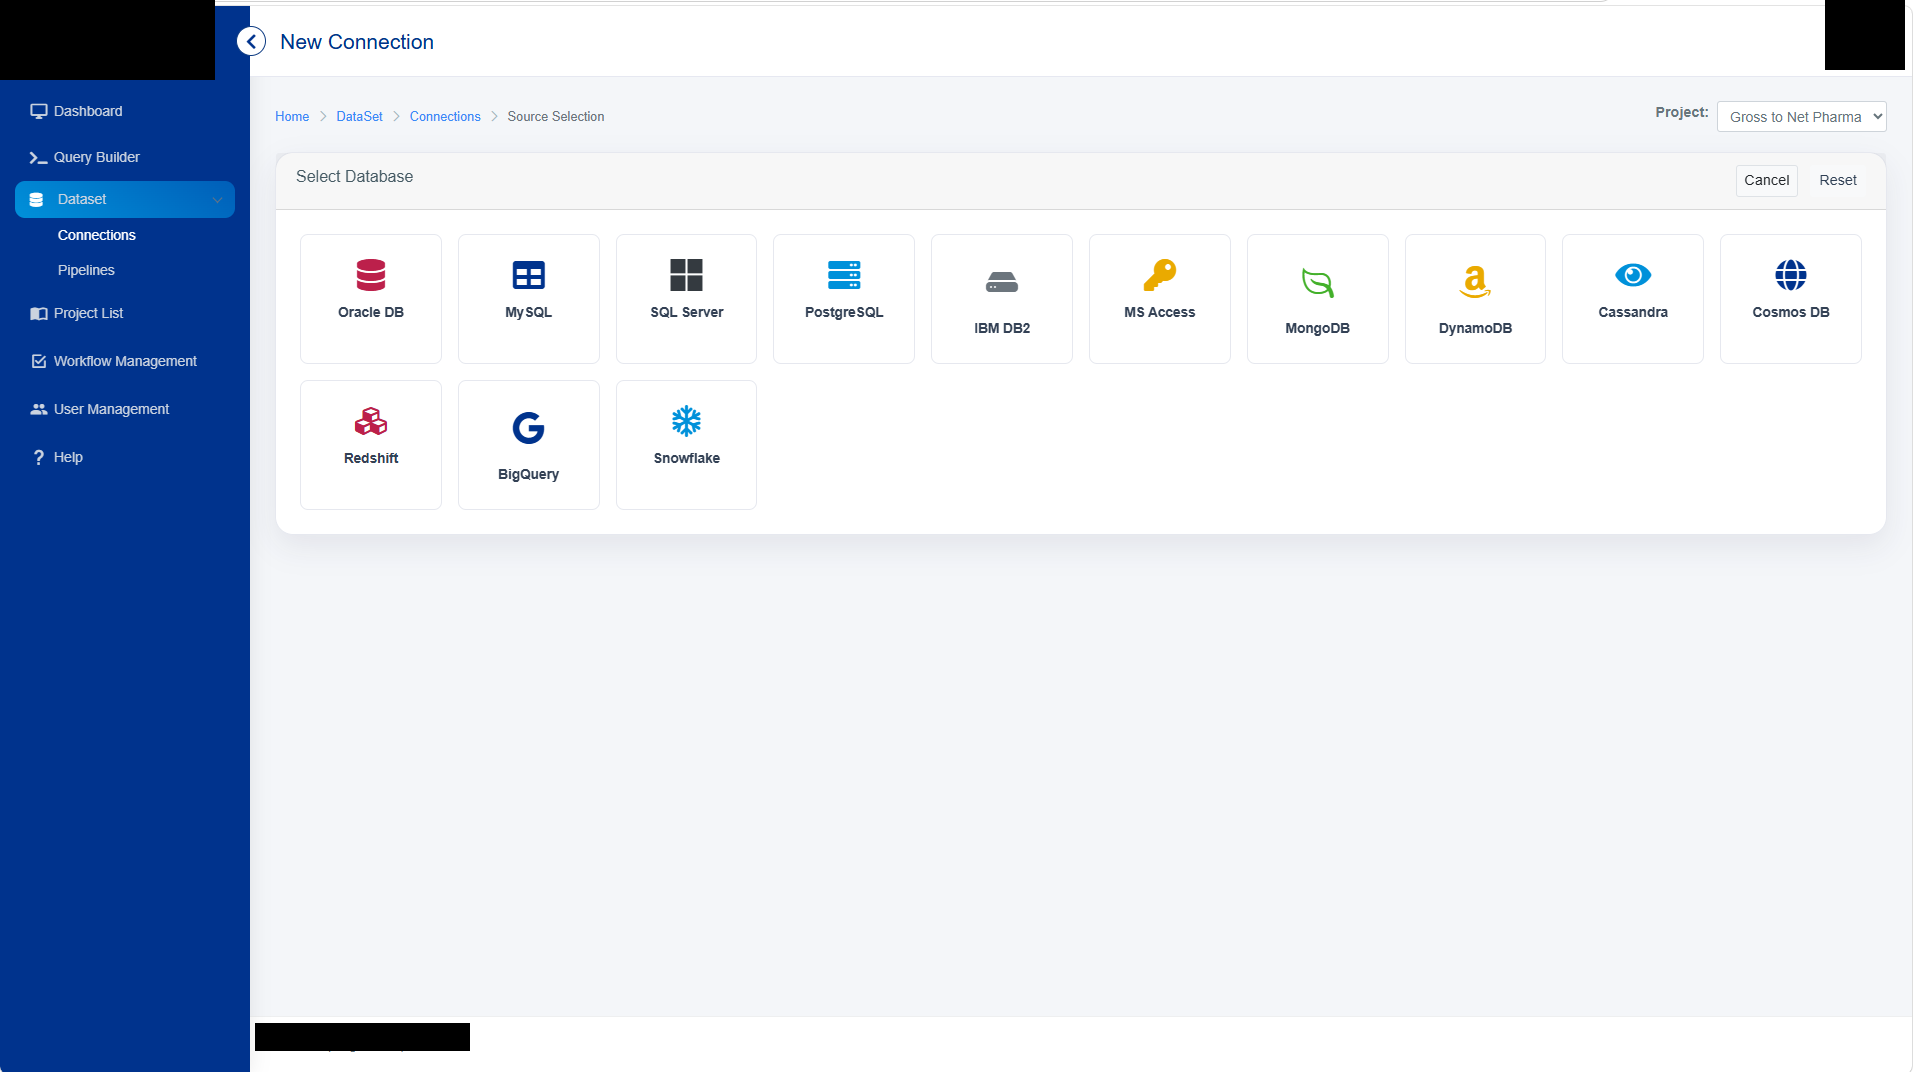
Connectors to thirteen-plus databases plus flat-file upload. Connections are tested, saved and reused, each with its own refresh schedule.
A rule builder
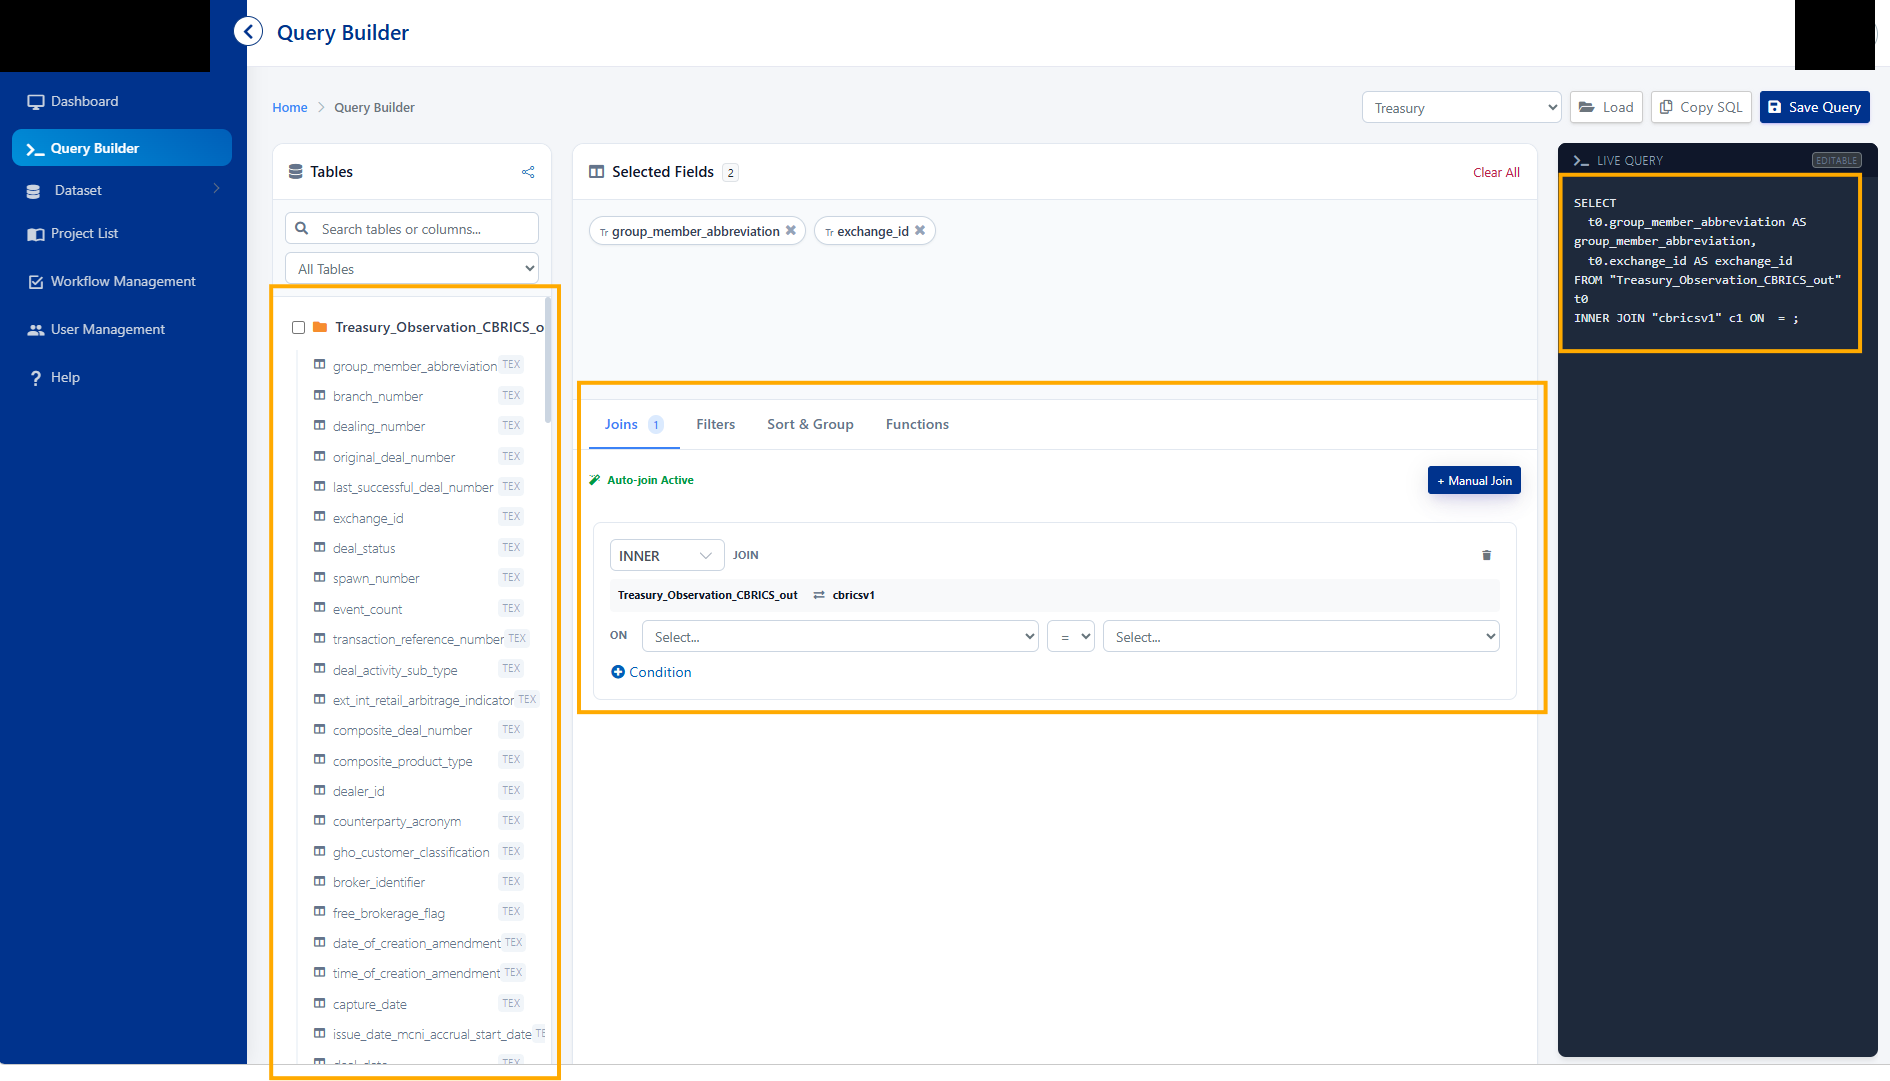
A drag-and-drop canvas where an auditor picks tables, joins them, adds filters and grouping, and watches the SQL assemble live. No scripting.
An execution engine
Rules run against the full dataset on demand or on a schedule. Anything that breaches a rule becomes an exception.
A workflow layer
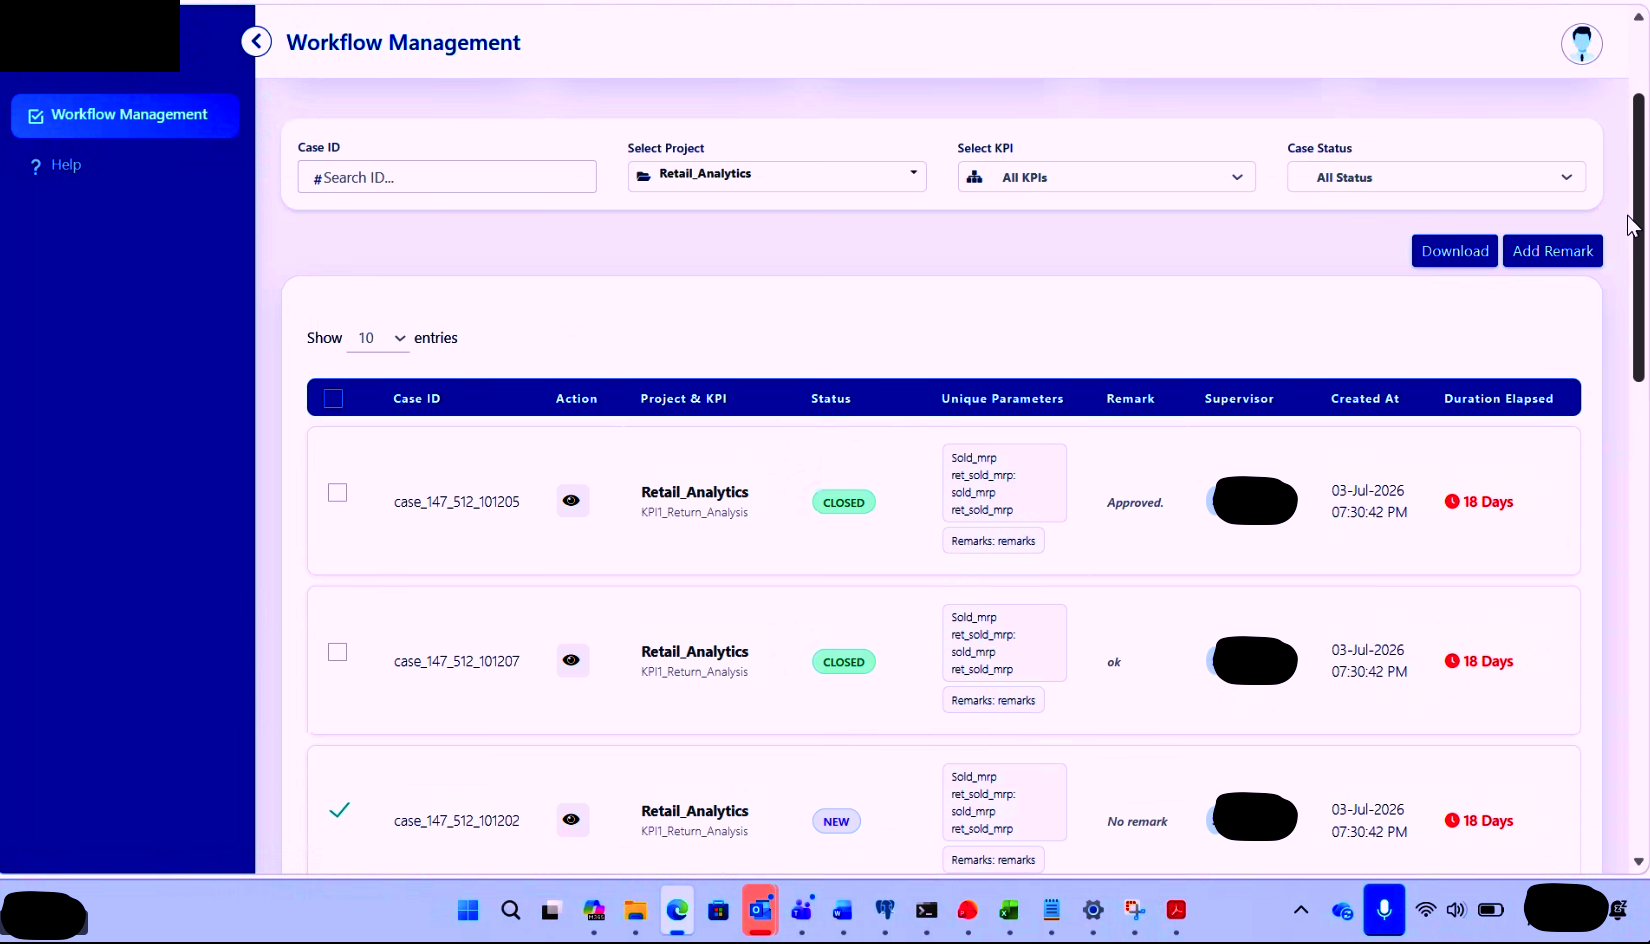
Exceptions become cases with an owner, a status and a comment thread. Supervisors approve or send back. Email goes out automatically.
Reporting
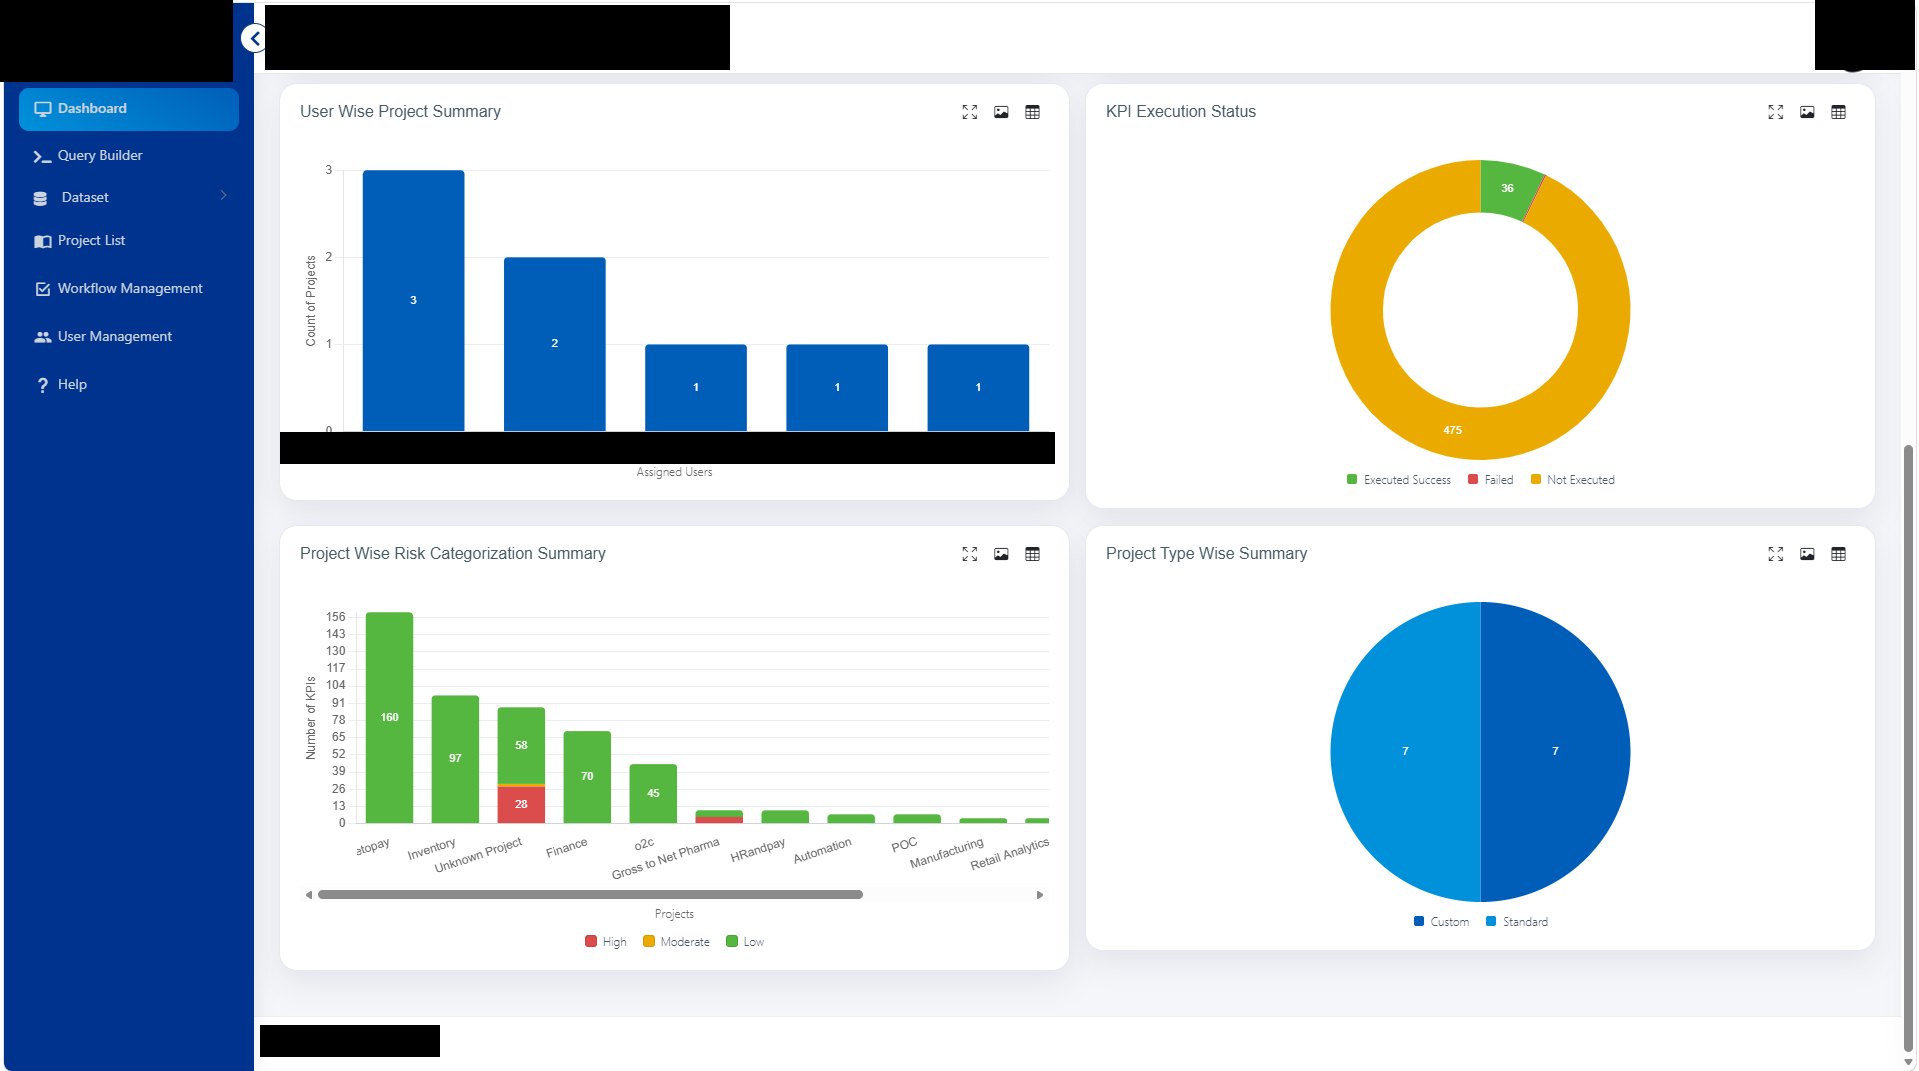
Results feed embedded BI dashboards sitting alongside each project.
Architecture decisions we'd defend
Genuine trade-offs, made deliberately — not defaults we back-filled a reason for.
One query, thirteen dialects
The obvious build has the UI emit SQL strings. That works until your second connector — Oracle and PostgreSQL disagree about dates, MongoDB and Cassandra don't speak SQL at all. So the builder emits a structured query object instead, and dialect compilers turn it into whatever the target speaks. A fourteenth source becomes a compiler, not a rewrite.
Staged, not pushed down
Full query pushdown into a document store means writing and maintaining an aggregation-pipeline compiler forever. We chose to extract non-relational sources on a schedule and run every rule through one PostgreSQL execution path — one code path to explain to an auditor, at the cost of freshness. We added true pushdown later for Snowflake and BigQuery specifically, where scanning is what you pay for.
Every run leaves a receipt
The audit trail is append-only from the start. Every execution logs who ran it, when, and how many exceptions came back — failed runs too, with the failing SQL captured verbatim. When a rule silently returns zero exceptions, the log has to answer “did it actually run?” without anyone touching a server.
The parts that were genuinely hard
Four problems that only showed up once the product met real data, real tables and real IT constraints.
One control returned 140,000 exceptions and took the browser down
The result grid fetched rows and rendered a table — fine on tidy test data, until a returns-eligibility control hit a real retail dataset and the tab locked up. Three fixes: server-side pagination, summary math (count, sum, average) moved into SQL instead of JavaScript, and a virtualised grid that only paints what's on screen. The bigger problem was downstream — auto-creating a case per exception would have buried the workflow queue in a week, so case creation became batched and selective instead of automatic.
The mapping UI stopped working at the size real tables actually are
Drag-a-line-from-here-to-there is lovely with ten fields a side. The client's tables have 58 columns, and on a canvas that's a hairball people mis-map without noticing. Above fifteen columns the interface now switches automatically to a searchable grid with dropdowns, name-similarity auto-mapping, and type-mismatch detection that flags a bad join before you commit instead of at execution.
Scheduling that survives a restart
The first version held scheduled jobs in an in-memory timer, which meant every scheduled run quietly vanished on a server restart — not acceptable when the product's entire promise is “this runs continuously.” We moved to a database-backed job table with claim-and-lease semantics: a crashed worker's jobs become claimable again once its lease expires, and runs are idempotent so a half-completed job doesn't double-count on retry.
Deployable into a locked-down environment
Target environments are on-premise Linux boxes with no outbound internet and IT teams that won't accept a black box. That ruled out anything SaaS-flavoured: email goes through a configurable SMTP relay, the whole thing ships as a version-pinned Docker bundle, and BI reporting integrates by embedding dashboard URLs rather than calling a reporting API — letting the client keep dashboards under their own licences and row-level security, without us brokering credentials we had no business holding.
Getting exceptions to the person who fixes them
Most tools in this space stop at the report. That's where the value leaks out — a spreadsheet of 50,000 exceptions lands in an inbox and nothing happens, because nobody owns any individual line of it. Each escalated exception becomes a case with an ID, an assigned supervisor, a status, and the business parameters that identify the underlying record, so a reviewer can act without going back to the source system.
The activity timeline is immutable — system events and human actions append in order, nothing editable after the fact. A stakeholder comments, a supervisor rejects with a reason, the stakeholder responds with evidence, the supervisor approves. That whole exchange is the audit evidence, which is the point.
What it produced
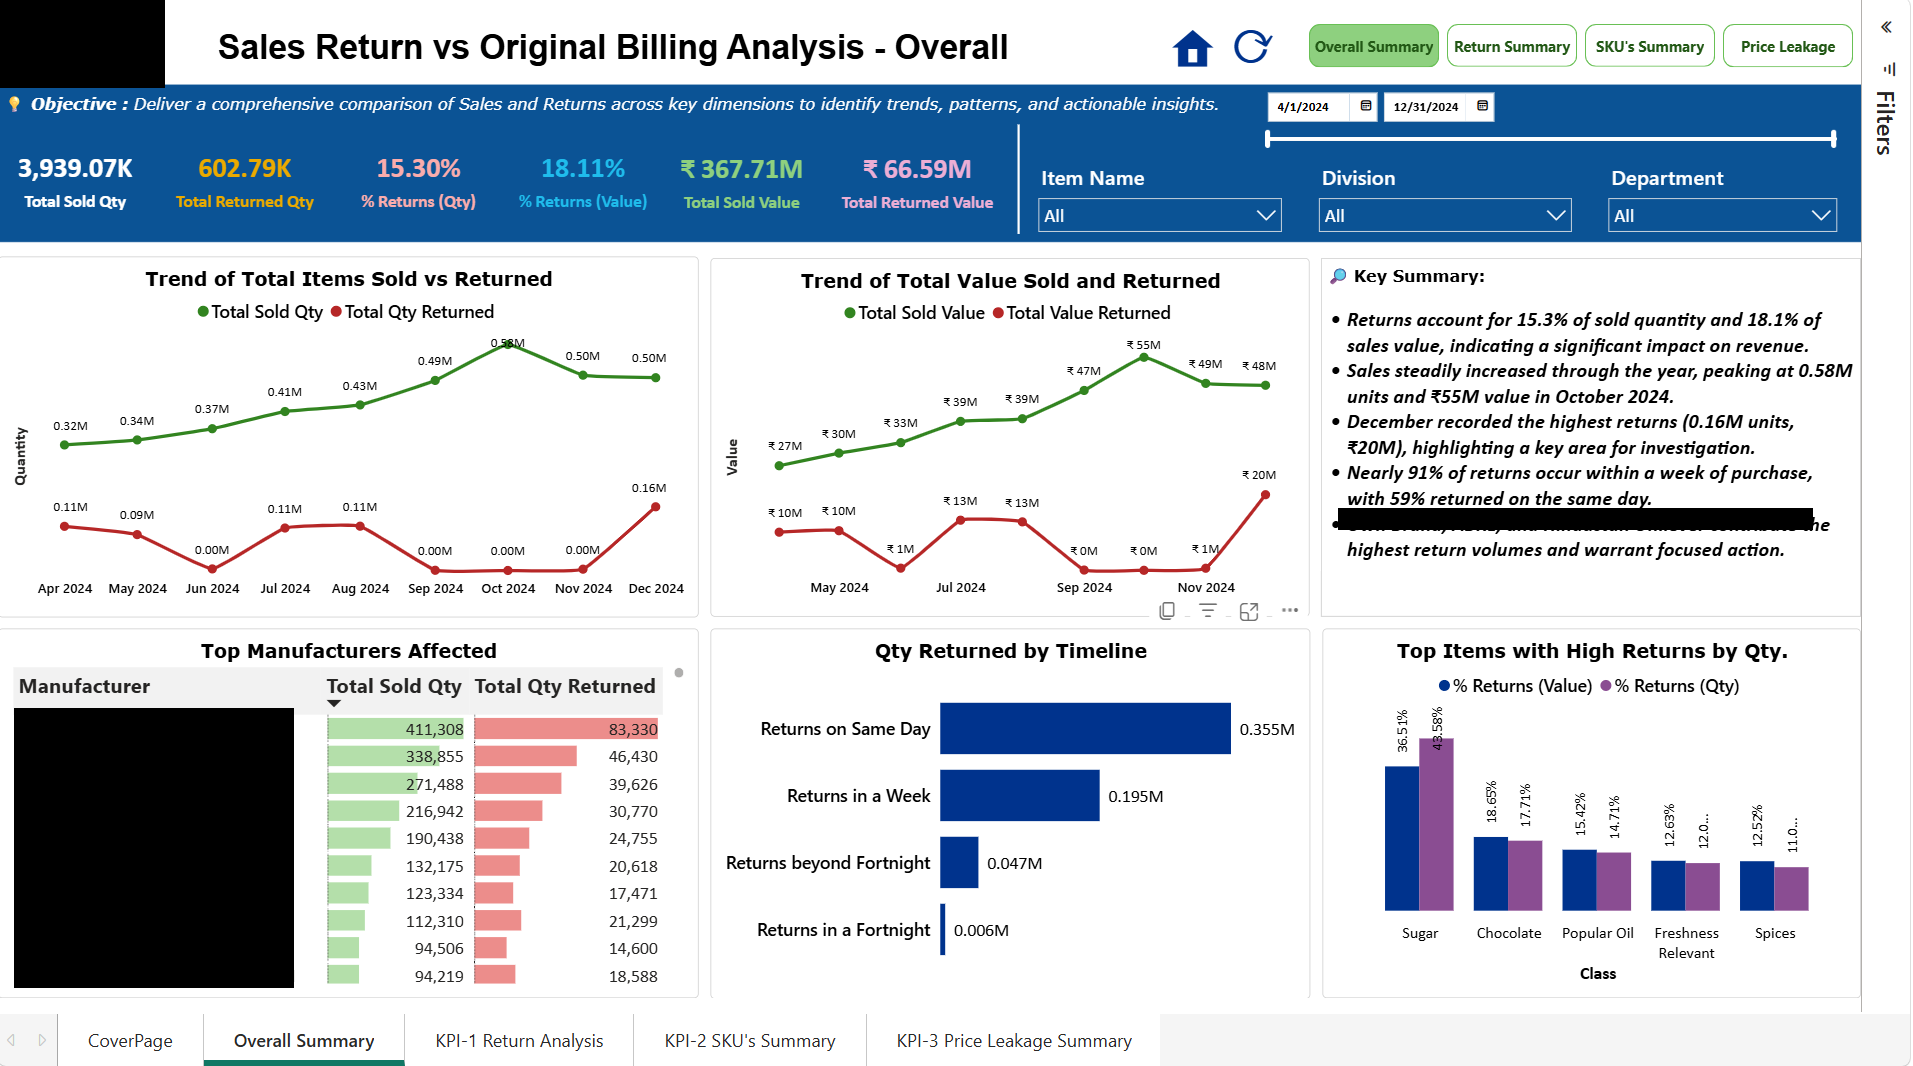
The number that matters most isn't in the grid below: coverage went from a few hundred sampled transactions to the entire population, every run.
₹1.4M
Revenue leakage surfaced by one pricing control — invisible to sample-based testing
500 hrs
Analyst time saved per cycle on one automated control set — about two months of work
575+ / 600+
Standard and industry-specific controls in the reusable library
100%
Population coverage every run — up from a few hundred sampled transactions
What we'd do differently
Build the intermediate representation first. We retrofitted it after the second connector, unpicking SQL-string assumptions that had already spread through the codebase. We knew better — the first connector just shipped faster without it.
Design the workflow module against realistic exception volumes. Building it against clean test data hid the 140,000-case problem until integration, and the fix touched the data model, not just the UI.
Budget properly for the evidence plumbing. We scoped this as an analytics product with logging bolted on. In a compliance tool, the run history, the immutable timeline and the reproducible deployment are the product — the analytics is the easy part.
Ready to Get Started?
Book a free discovery call and let's explore how Dev can accelerate your business with AI-first solutions.
🍪 We use cookies
We use cookies to analyze site traffic and improve your experience. No personal data is sold.